Christy Ehlert-Mackie

Data Analyst who 💗 Excel | SQL | Tableau | I analyze and interpret data so companies have the information and insights they need to make sound business decisions.
View My LinkedIn Profile
View My Tableau Public Profile
Welcome to My Portfolio!
My portfolio has moved to a new site:
Check out my new portfolio here!
Check out My Projects:
Beyond the Numbers: Discovering Insights in Animal Shelter Data
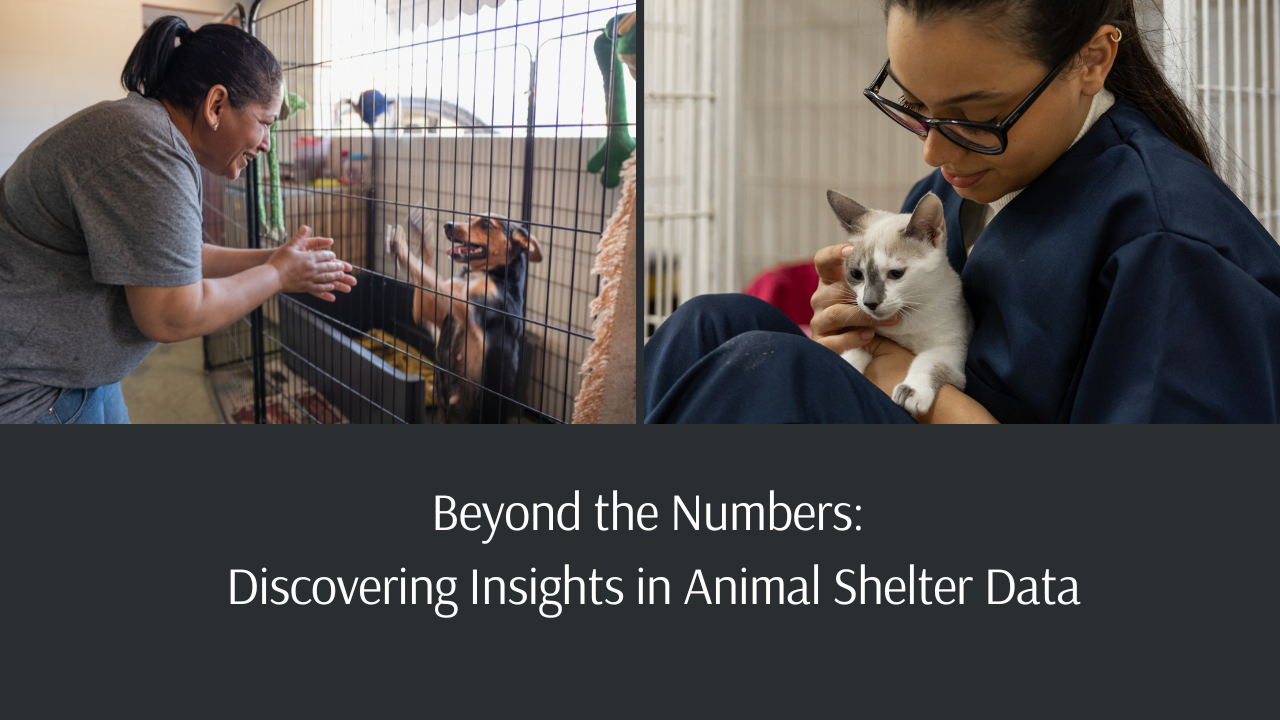 I used Excel and Tableau to analyze data for Louisville Metro Animal Services. I provided insights and recommendations to help LMAS plan and use resources as well as identify opportunities to better serve the geographic area.
Delivering DoorDash Marketing Insights
 I used various techniques in Excel to analyze DoorDash marketing data for a recent campaign. I provided insights on the campaign’s performance and recommendations for future marketing campaigns.
How Are Massachusetts’ Schools Performing?
 I used Tableau to analyze and visualize education data for the State of Massachusetts. The questions answered were:
How does class size affect college attendance rates?
Which schools have the lowest graduation rates?
What are the top school districts in the state for 4th grade math scores?
I used Tableau to analyze and visualize education data for the State of Massachusetts. The questions answered were:
How does class size affect college attendance rates?
Which schools have the lowest graduation rates?
What are the top school districts in the state for 4th grade math scores?
Building a Better Economic Future
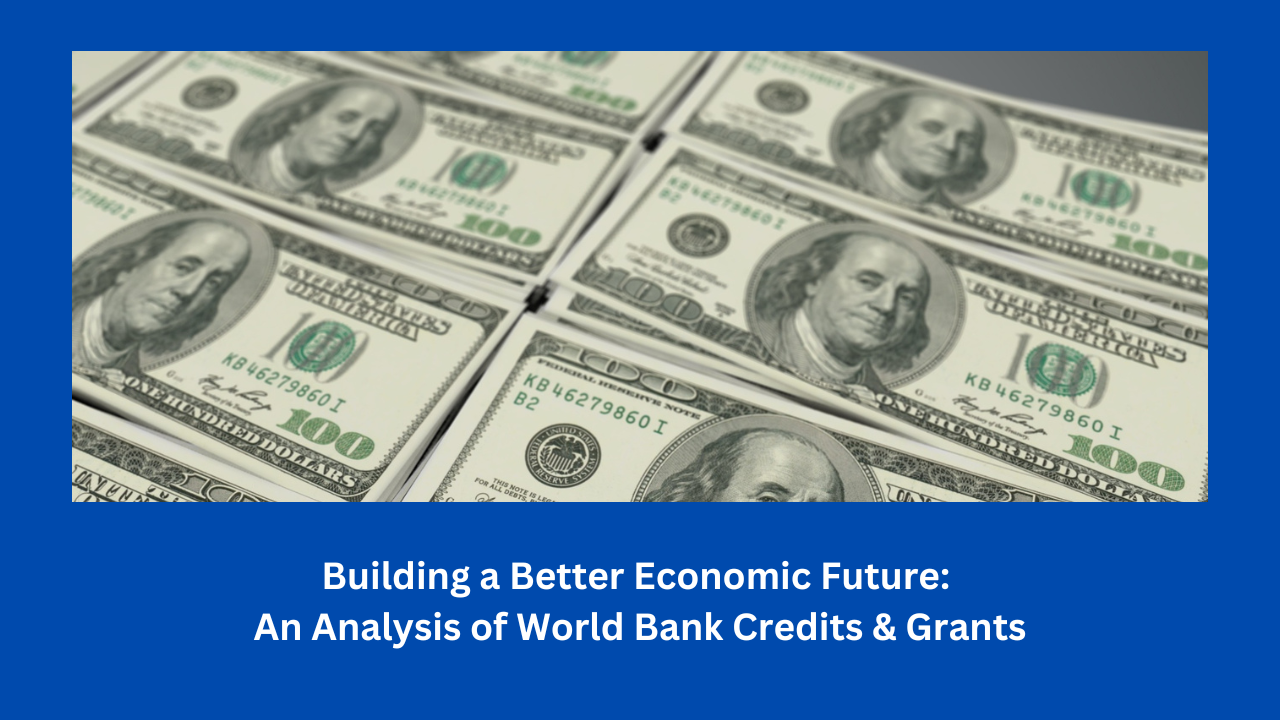 I used SQL to analyze a dataset of transactions from World Bank and provide insights. World Bank gives credits and grants to developing countries with the goal of reducing poverty and building prosperity.
Analysis of Hospital Patient Data Using SQL
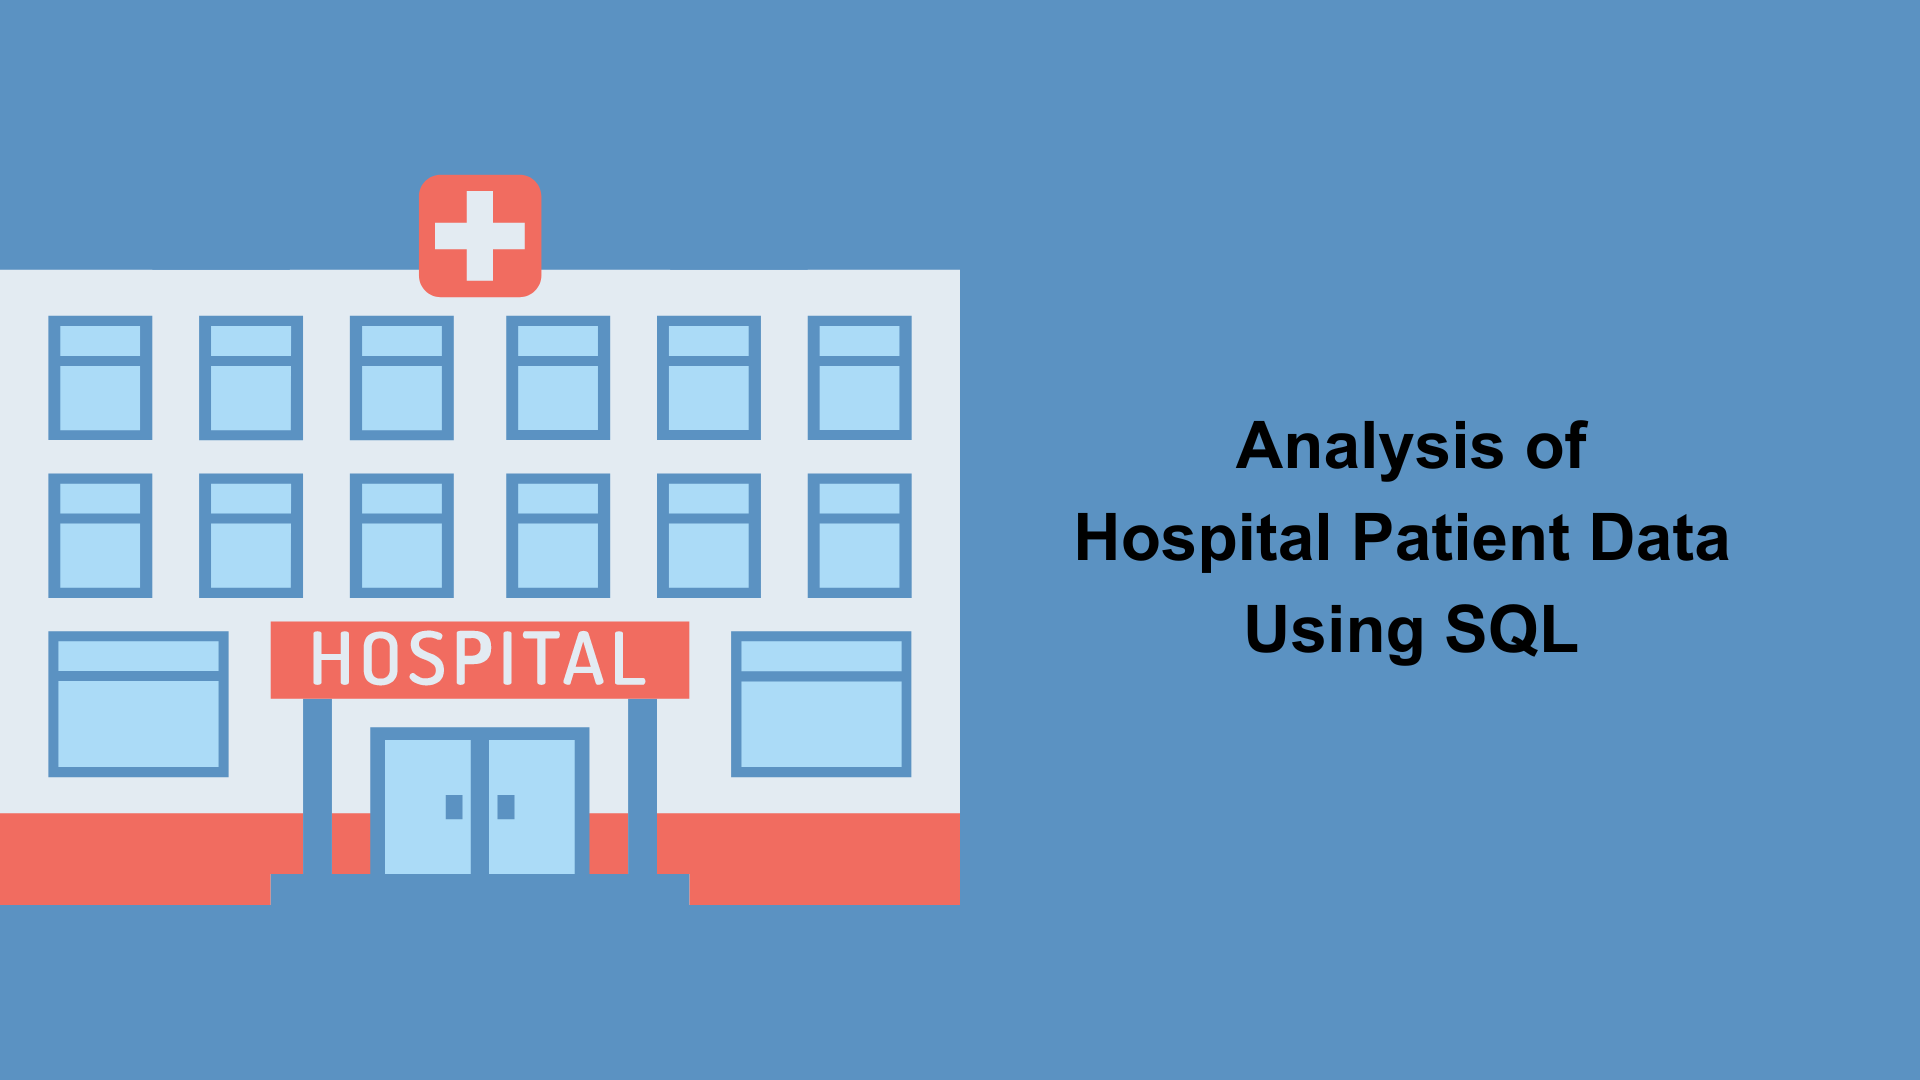 I used intermediate SQL to analyze hospital patient data to answer various questions. Functions used include RPAD, HAVING, JOIN, CASE WHEN, UNION, CTEs, subqueries, and CONCAT.
Shooting for Insights
 I used Tableau to analyze and visualize NBA player statistics for the 2021-22 season for the league overall and for the Minnesota Timberwolves. The questions answered were:
What position is most efficent at shooting 3-pointers for each team?
How did individual players perform last season in terms of points, assists, and total rebounds?
What were the total points for each team and each player on the team?
What players had the most assists in every position?
I used Tableau to analyze and visualize NBA player statistics for the 2021-22 season for the league overall and for the Minnesota Timberwolves. The questions answered were:
What position is most efficent at shooting 3-pointers for each team?
How did individual players perform last season in terms of points, assists, and total rebounds?
What were the total points for each team and each player on the team?
What players had the most assists in every position?
Iron Mining Python Data Analysis
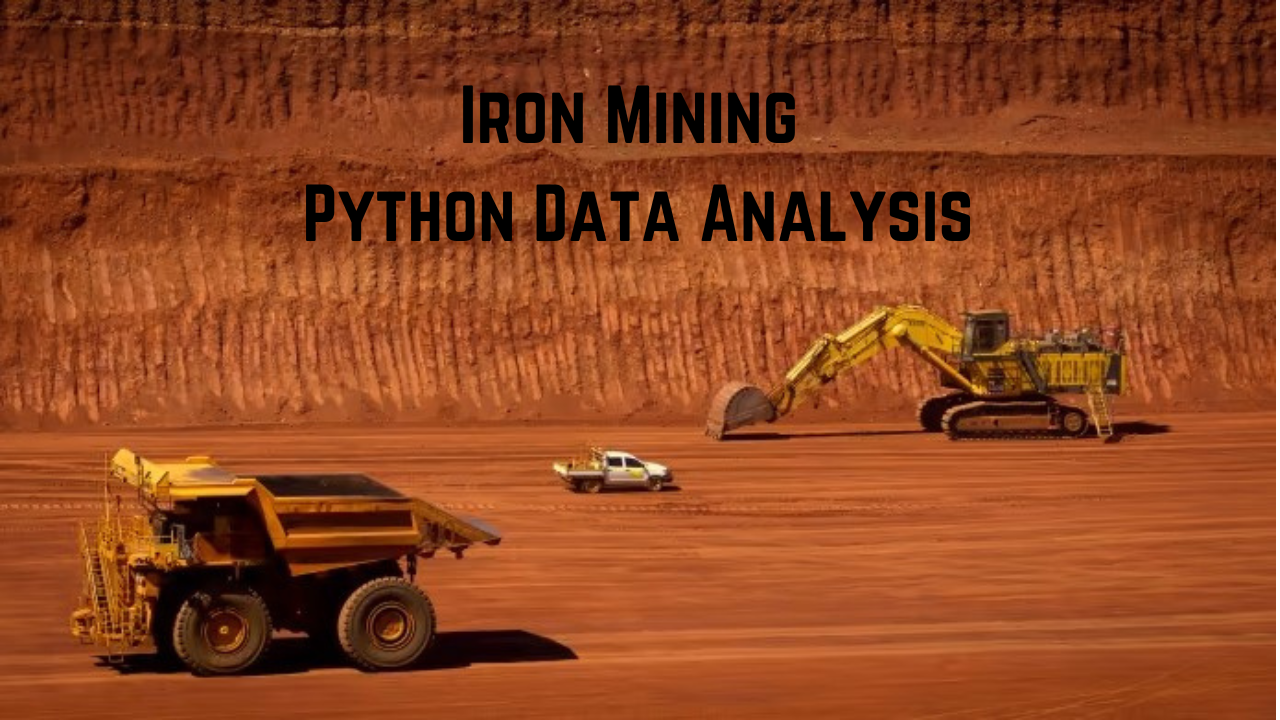 I used the Python packages Pandas, Matplotlib, and Seaborn in a DeepNote notebook to clean, manipulate, analyze, and visualize data.
IBM HR Analytics
 I used R to analyze Human Resources data using statistical techniques such as correlation, hypothesis testing, and linear regression.